PDF

as a Summer Analyst at AIM13

Data Center Industry

A briefing on the data center industry at the start of the AI buildout: what data centers do, why the largest technology companies are pouring capital into them, how growth and energy estimates have escalated, the constraints and risks on that growth, why liquid cooling is the next inflection, and where public and private investors are most exposed.

Contents
  1. Overview
  2. Magnificent 7 Paving the Way
  3. Comparison to Dot-com Bubble
  4. Growth Estimates
  5. Energy Estimates
  6. Growth Constraints
  7. Risks
  8. Liquid Cooling
  9. Future of Liquid Cooling
  10. Key Players
  11. Private Markets
  12. Top Investors

Overview

  • What are they?
    • Massive facilities up to hundreds of football fields in size housing computer systems and storage
  • What do they do?
    • Process and store enormous amounts of data
  • Why are they crucial for AI?
    • Provide the computing power to train AI models
    • Store the vast datasets AI needs to learn and improve
    • Enable real-time AI inferencing and decision-making at scale
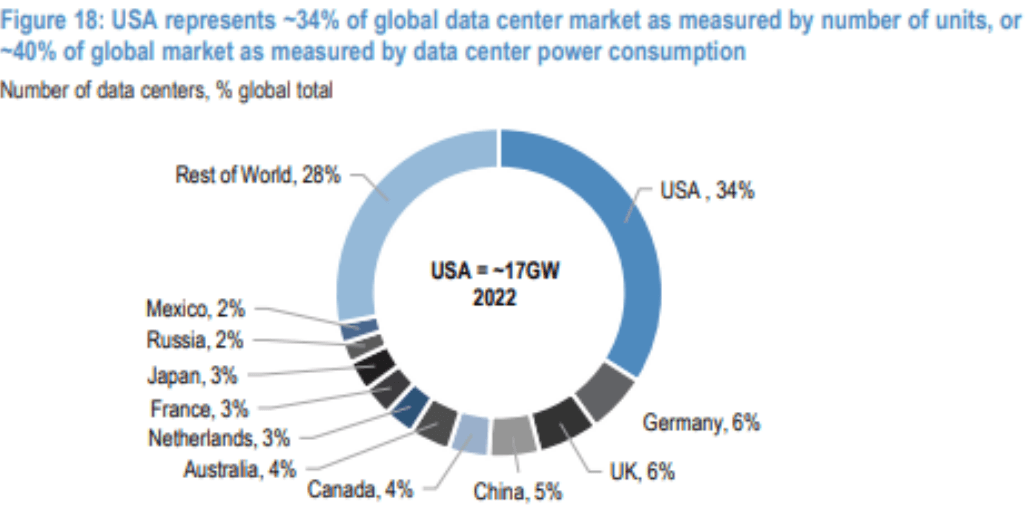
Donut chart of the global data center market by number of units: USA 34%, rest of world 28%, then Germany, UK, China, Canada, Australia, Netherlands, France, Japan, Russia, and Mexico.
USA represents about 34% of the global data center market by number of units, or about 40% by power consumption
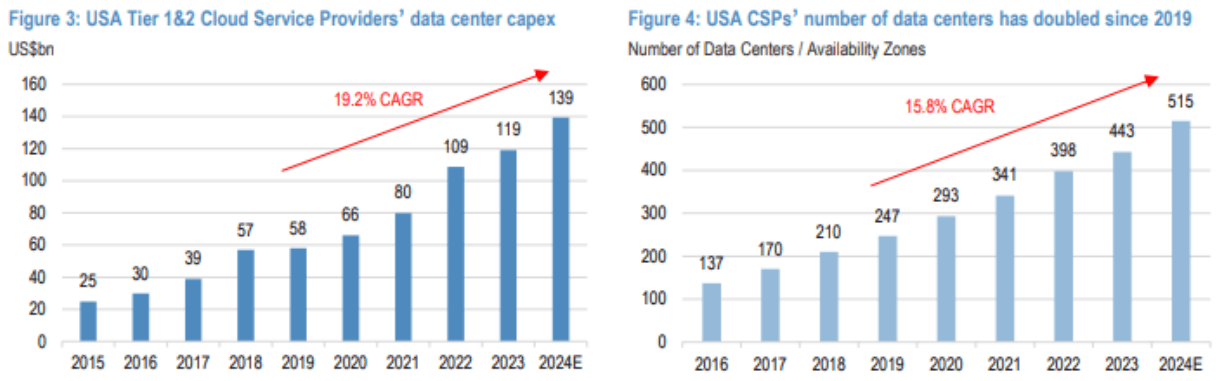
Two bar charts: US tier 1 and 2 cloud service providers’ data center capex growing at a 19% CAGR since 2019, and the number of data centers and availability zones roughly doubling over the same period.
US cloud service providers’ data center capex, and their count of data centers and availability zones, which has doubled since 2019

Since 2020, inventory growth in primary data center markets was led by Hillsboro, followed by Atlanta, Northern Virginia, Phoenix, Silicon Valley, Dallas Ft. Worth and Chicago, while New York growth was lower, at 334%, 118%, 107%, 103%, 69%, 60%, 57% and 29% respectively.

Magnificent 7 Paving the Way

  • Meta logo

    Undergoing data center restructuring, has lease obligations of ~$6.17B

  • Nvidia logo

    427% YoY growth in data center revenue (78% of total revenue)

  • Amazon logo

    Planning to spend $150B on data centers in next 15 years
  • Tesla logo

    24% YoY growth in capex (2023)

  • Google logo

    91% YoY growth in capex

  • Microsoft logo

    66% YoY growth in capex

  • Apple logo

    Capex has remained stable

Source: Q1 2024 SEC filings.

Comparison to Dot-com Bubble

2000

  • Top 5 US stocks 15% of S&P 500’s value
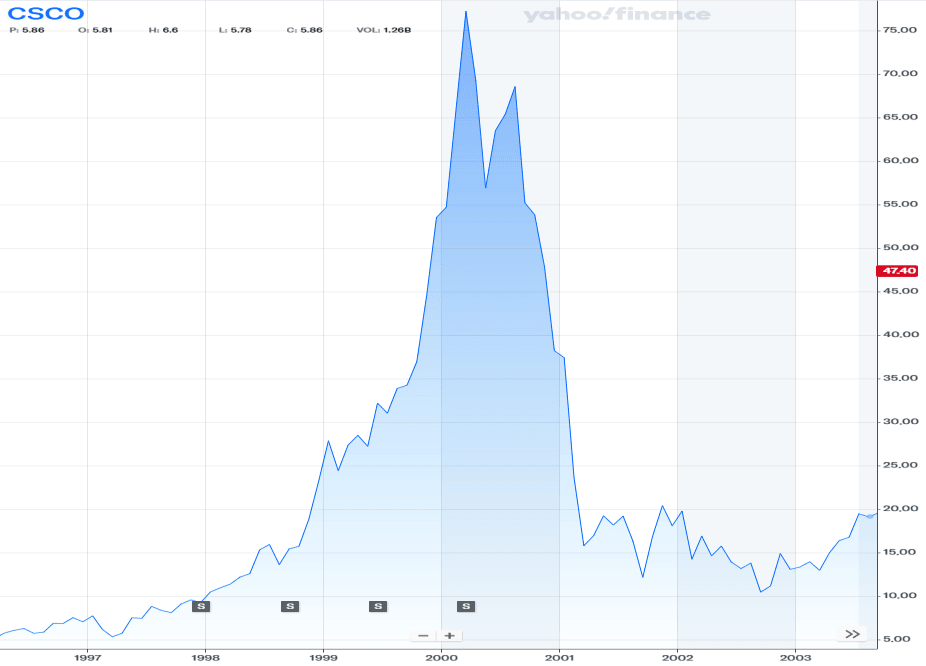
  • Cisco P/E: 150
  • Cisco average net margin (1996–2000): 17%
  • CSCO rose 700% during dot-com bubble
Cisco share price chart from the mid-1990s through the early 2000s, rising steeply into 2000 and collapsing after.

2024

  • Top 5 US stocks 25% of S&P 500’s value
  • Nvidia P/E: 75
  • Nvidia’s 5-year average net margin: 27.9%
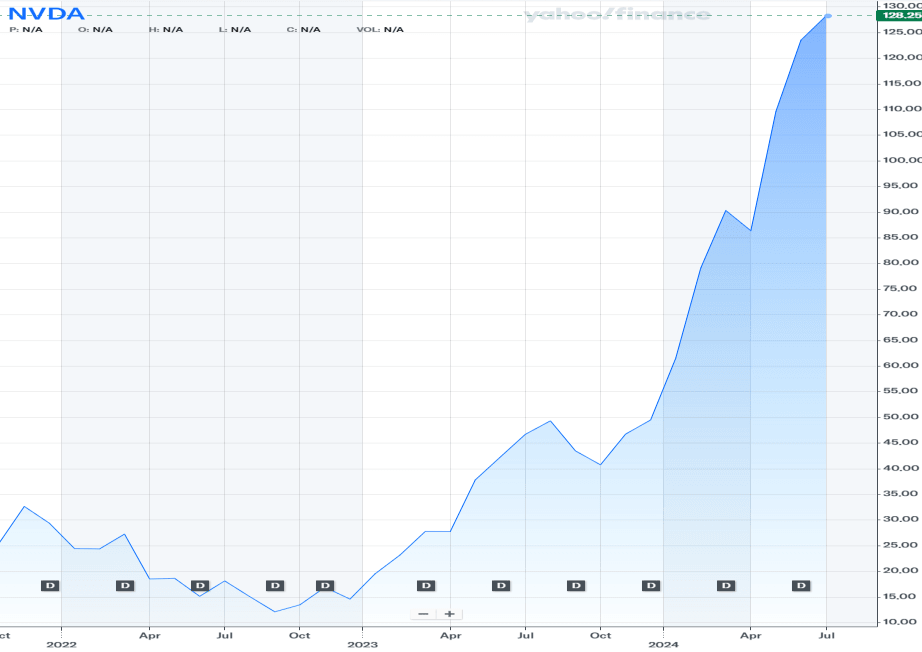
  • NVDA rose over 500% since Oct 2022
Nvidia share price chart from 2019 through mid-2024, rising sharply from late 2022.

Growth Estimates

  • Expected growth for data centers has increased over time
    • McKinsey, 01/23: 10% CAGR to 2030
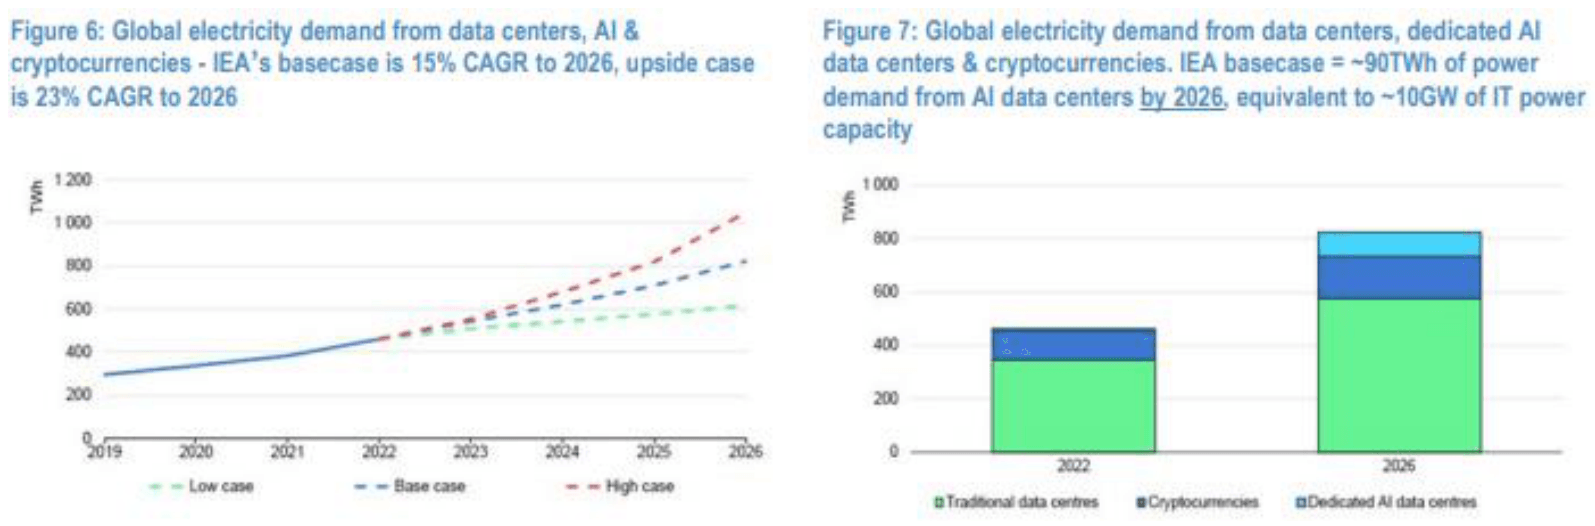
    • IEA, 01/24: 15% CAGR to 2026
    • SemiAnalysis, 03/24: 23% CAGR to 2026
    • JPMorgan, 04/24: 25% CAGR to 2026
  • AI should account for ~90% of the growth
    • Total AI compute capacity is growing 50–60% per quarter
  • JPMorgan estimates infrastructure market moving from $22B in 2023 to $46B in 2026
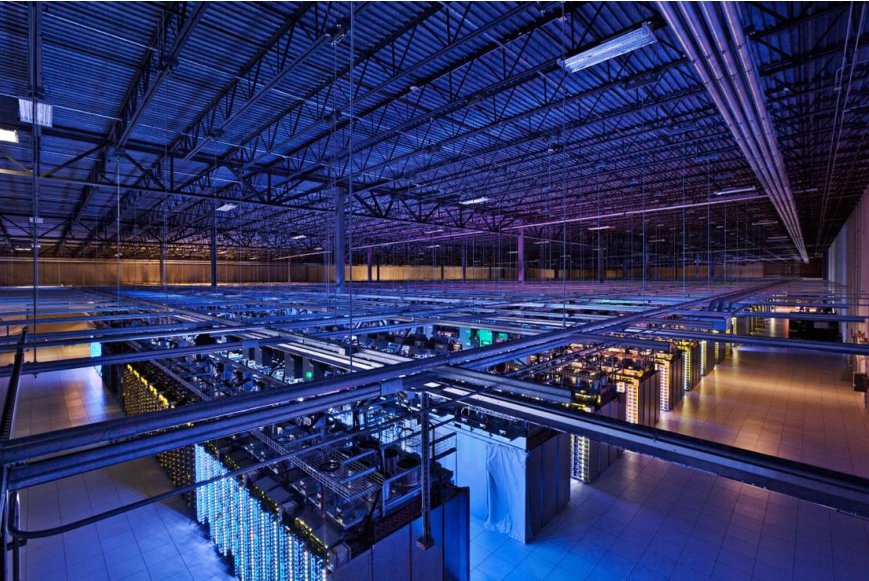
Interior of a large data center hall with long rows of server racks under blue lighting.
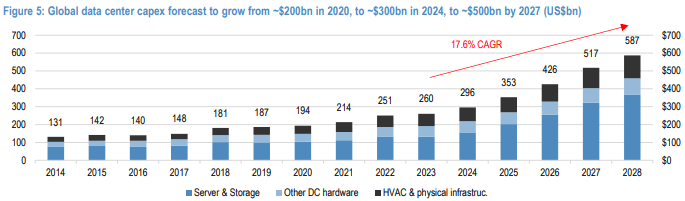
Stacked bar chart of global data center capex by servers and storage, other data center hardware, and HVAC and physical infrastructure, growing at an 11.8% CAGR from 2014 to 2028.
Global data center capex forecast to grow from about $200B in 2020 to about $300B in 2024 and about $500B by 2027

Energy Estimates

  • Additional MW per year will grow at 25% CAGR from 2023 levels to 2026
  • Electric Power Research Institute predicts data centers will consume 4.6–9% of all energy by 2030
  • Roughly a third of US nuclear power plants are in talks with tech companies to provide electricity for data centers
    • Amazon closed deal with Constellation Energy to purchase nuclear-powered data center for $500M
    • Deals have potential to remove stable power generation from the grid, concern over massive users of energy getting first dibs
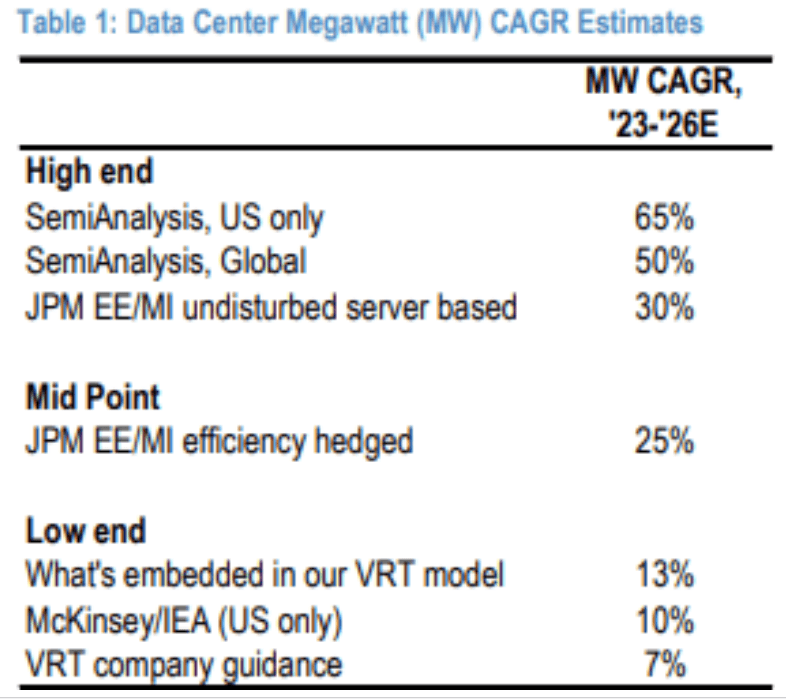
Table of data center megawatt CAGR estimates for 2023 to 2026: high end 65% (SemiAnalysis US), 50% (SemiAnalysis global), 30% (JPM undisturbed server based); mid point 25% (JPM efficiency hedged); low end 13% (VRT model), 10% (McKinsey/IEA US), 7% (VRT company guidance).
Table 1. Data center megawatt (MW) CAGR estimates
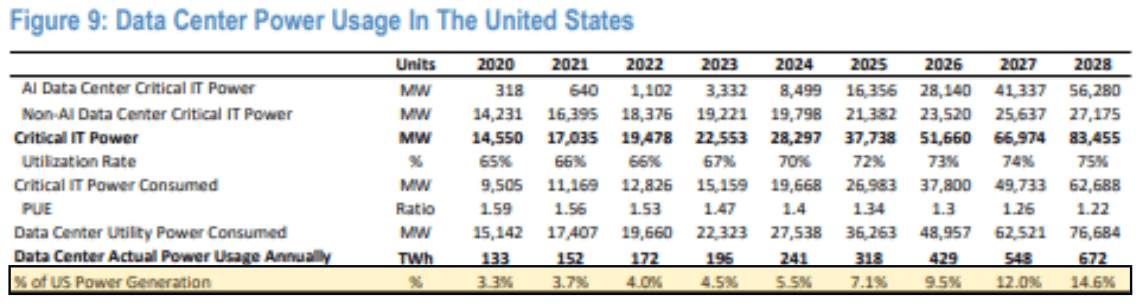
Table of US data center power usage from 2020 to 2028 in MW and TWh, including AI and non-AI critical IT power, utilization rate, and share of US power generation.
Data center power usage in the United States
Two charts: global electricity demand from data centers, AI, and cryptocurrencies with low, base, and high cases through 2026, and a bar chart splitting 2022 and 2026 demand into traditional data centers, cryptocurrencies, and dedicated AI data centers.
Global electricity demand from data centers, AI and cryptocurrencies. The IEA base case is a 15% CAGR to 2026 with an upside case of 23%. Dedicated AI data centers reach about 90 TWh by 2026, equivalent to about 10 GW of IT power capacity

Growth Constraints

  • Energy constraints could decrease growth estimates by ~30%, but tech progress could decrease energy needs
    • Uptime Institute found that data center energy usage increased only 6% between 2006 and 2018, while compute and storage capacity increased by factors of 6 and 25 respectively
  • Average data center construction timeline ranged between 1–3 years until 2020, and now ranges between 2–6 years
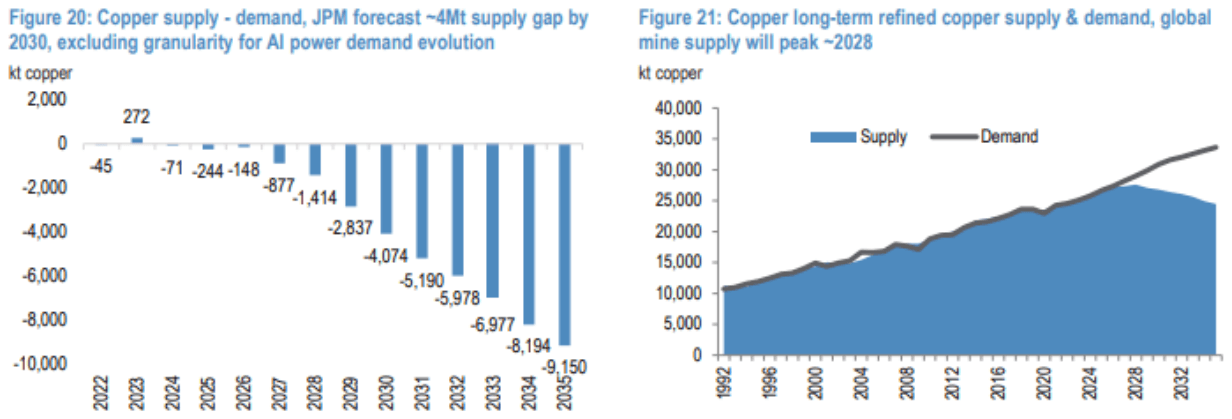
  • Data centers require 20 to 40 tons of copper
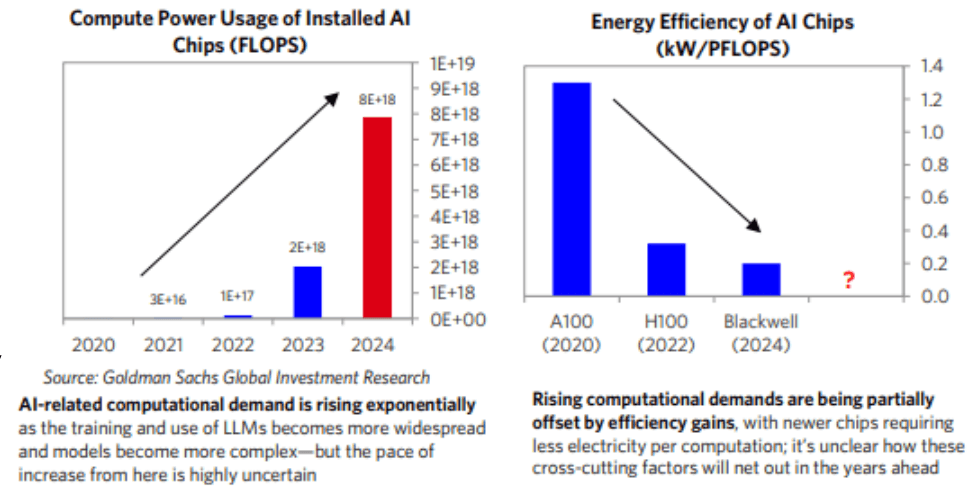
Two bar charts: compute power usage of installed AI chips in FLOPS rising exponentially from 2020 to 2024, and energy efficiency of AI chips in kW per PFLOPS falling from the A100 to the H100 to Blackwell.
AI-related computational demand is rising exponentially and is only partly offset by efficiency gains in newer chips. Source: Goldman Sachs Global Investment Research
Two charts: JPMorgan’s forecast copper supply gap widening to about 4 million tonnes by 2030, and long-term refined copper supply and demand with mine supply peaking around 2028.
Copper supply and demand: JPMorgan forecasts a roughly 4Mt supply gap by 2030, with global refined supply expected to peak around 2028

Risks

  • Major risk is if the economic output of AI’s benefit doesn’t near the investment spent
    • Over the last 18 months reallocation of money has happened in the trillions with massive value expected to be gained over the next 10 years
  • States pushing for tax incentives for renewable and efficient data centers
    • Virginia, the largest primary market, proposed a data center efficiency bill requiring states to meet 1.2 power usage effectiveness or less or procure carbon free renewable energy that equals 90% of their data center electricity

AI is not the problem for increasing productivity, but people learning how to use it is.

Drew Cukor, Co-Head Chief Analytics Office at JPMorgan
Illustration of a person seated at a desk surrounded by glowing screens and floating data visualizations.

Liquid Cooling

  • Cooling is the fastest-growing expenditure in running the physical infrastructure of data centers
    • Increasing at 16% CAGR and accounting for 40% of all power used in data centers
  • Data centers increasing investments in electricity efficiency to decrease risk of energy constraint
    • Direct to chip cooling has the potential to reduce power usage per rack by 10%
    • Cost-effective cooling of high-density racks can be up to 3000 times more effective than using air
  • Liquid cooling is needed for certain countries’ legal restrictions
    • China targets a PUE of 1.3 for data centers
    • Several European data centers have agreed to control their PUE below 1.3
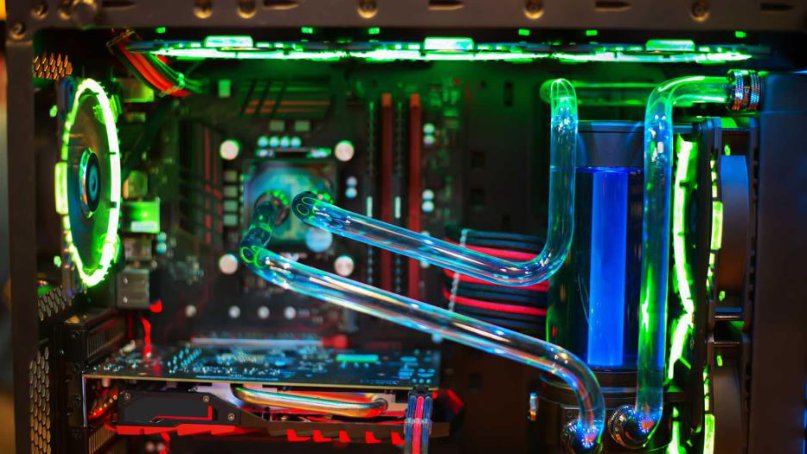
Close-up of a liquid-cooled computer with coolant tubing, radiators, and fans lit in green and red.

Future of Liquid Cooling

  • In next 2 years, VRT sees servers rapidly exceeding limits of air cooling
    • CSP ASIC servers will have over half of projects this year adopt liquid cooling
    • AMD’s next GPU will have a positive impact on liquid cooling
    • Nvidia’s next GPU will adopt air cooling, however, future generations will use more liquid cooling
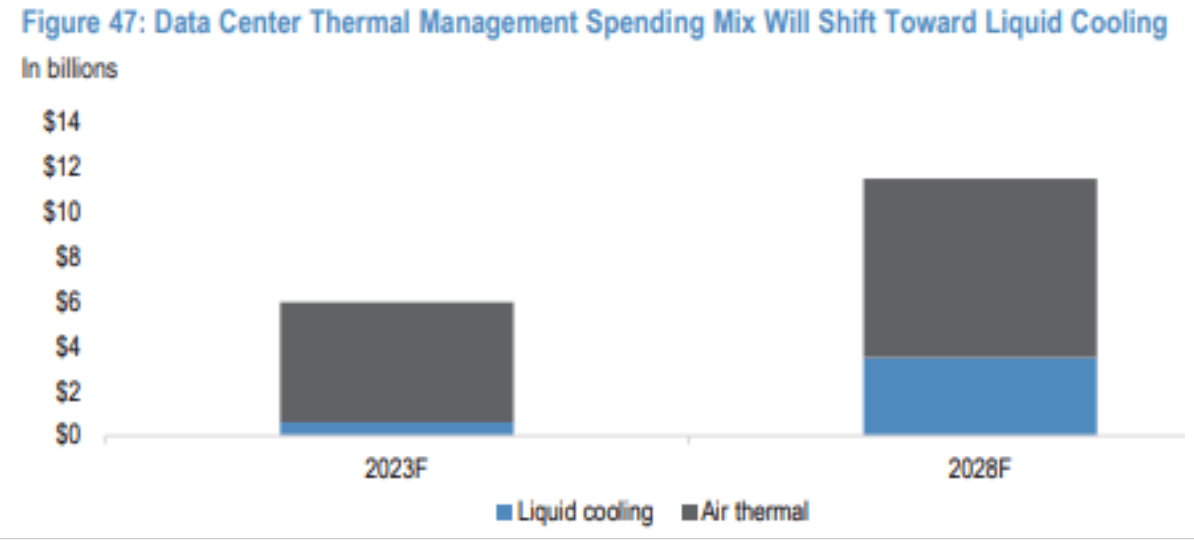
  • Liquid cooling market expected to near $3.5B in 2028
    • Growing from 10% to ~30% of all thermal management spending
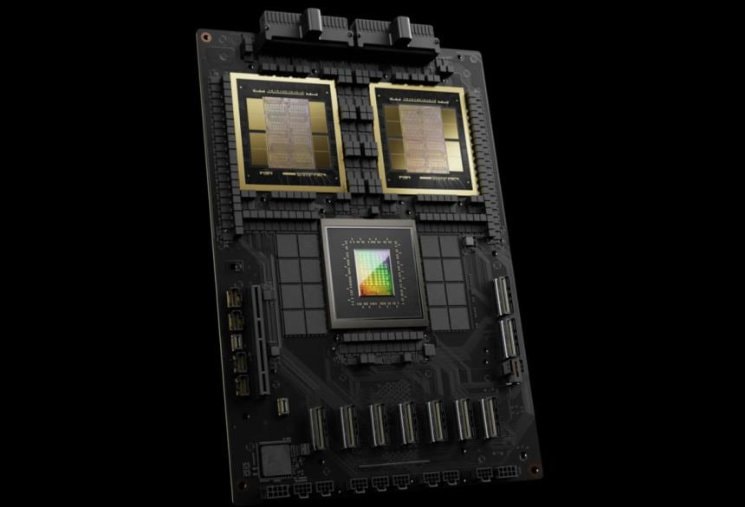
Top-down view of a dark GPU module with two large processor dies and surrounding memory.
Stacked bar chart of data center thermal management spending in billions for 2023F and 2028F, split between liquid cooling and air thermal, with liquid cooling growing from a small share to roughly 30%.
Data center thermal management spending mix will shift toward liquid cooling

Key Players

  • Vertiv is a data center infrastructure company that stands to capture the most share in the growing liquid cooling market
    • $2B opportunity in 3–5 years that VRT can capture 30% of
  • Hubbell is an electricity and utility solutions company that is most exposed to the power and utility markets associated with data centers
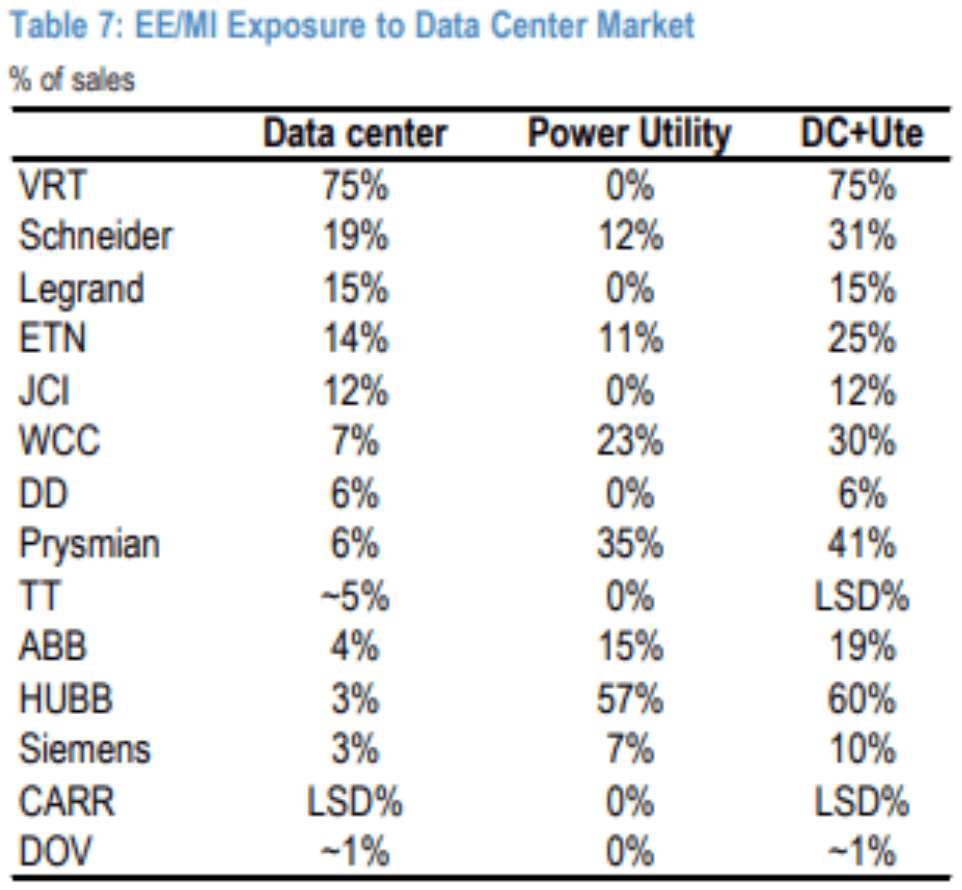
Table of electrical equipment and multi-industry companies’ exposure to the data center market as a percentage of sales, split into data center, power utility, and combined; Vertiv leads at 75% data center and Hubbell at 57% power utility.
Table 7. EE/MI exposure to the data center market, percent of sales

Private Markets

  • Performance of private digital infrastructure over the past decade has been robust due to support from government and growing demand for telecom and data center capacity
  • $800B of commitments to funds with some exposure to digital infrastructure, with $44B coming from specialist vehicles focused exclusively on digital infrastructure
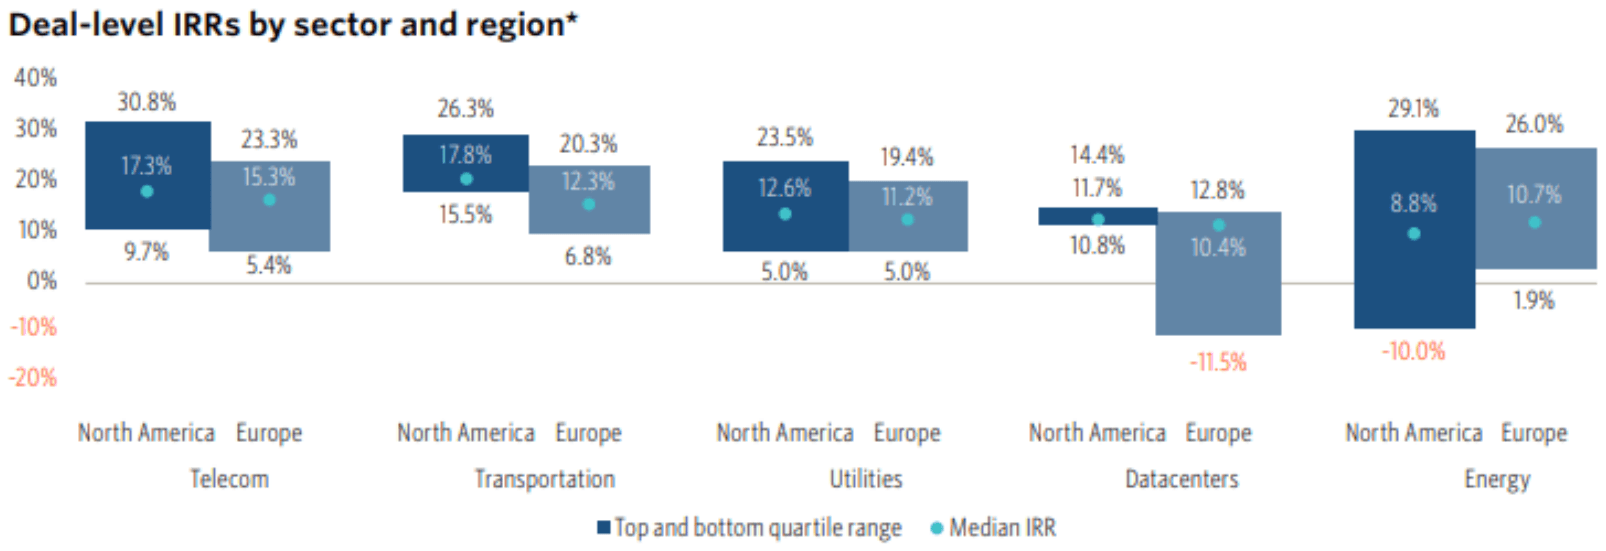
Floating bar chart of deal-level IRRs by sector and region for telecom, transportation, utilities, data centers, and energy in North America and Europe, showing the top and bottom quartile range and the median.
Deal-level IRRs by sector and region, showing the top and bottom quartile range and median IRR

Top Investors

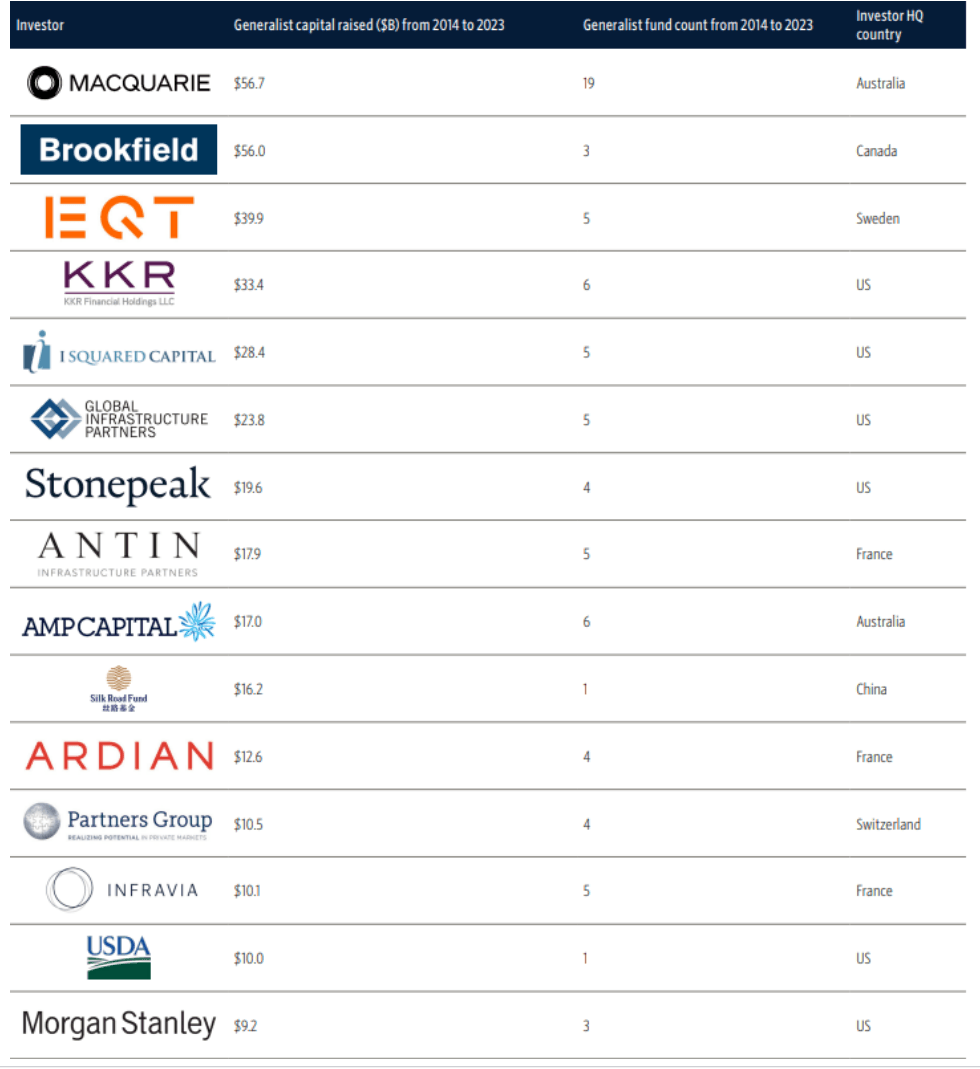
Table of generalist infrastructure funds with digital infrastructure exposure, including Macquarie, Brookfield, EQT, KKR, Stonepeak, Antin, AMP Capital, Ardian, Partners Group, and Morgan Stanley.
Generalist funds
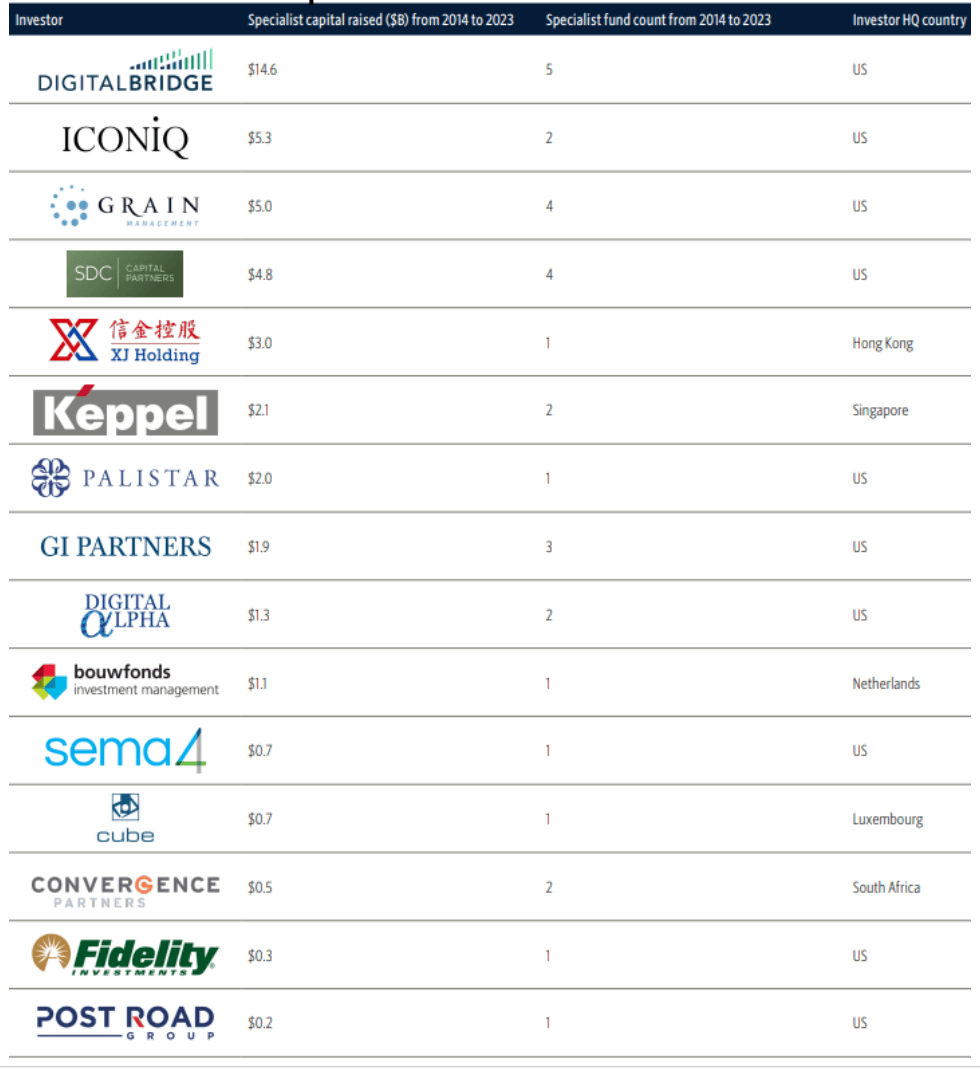
Table of specialist digital infrastructure funds, including DigitalBridge, Iconiq, Grain, SI Holding, Keppel, Palistar, GI Partners, Digital Alpha, Sema4, Convergence, Fidelity, and Post Road.
Specialist funds