Using data from Compustat and company CUSIPs screened through FactSet, I formed two datasets. One contains quarterly financial metrics and GICS sector classifications for 12,610 companies listed on the NYSE and NASDAQ from Q1 1990 to Q2 2024. The other includes annual variables for 1,459 IPO listings on these exchanges over the same period.
I examined whether companies’ past and current valuations are justified by their reinvestment of sales into R&D to deliver the products necessary to support long-term growth rather than speculation. To evaluate this I assessed gross margin, R&D-to-sales, and valuation multiples. Additionally, I explored similarities in the IPO environments by analyzing the proportion of unprofitable companies and technology companies going public each year.
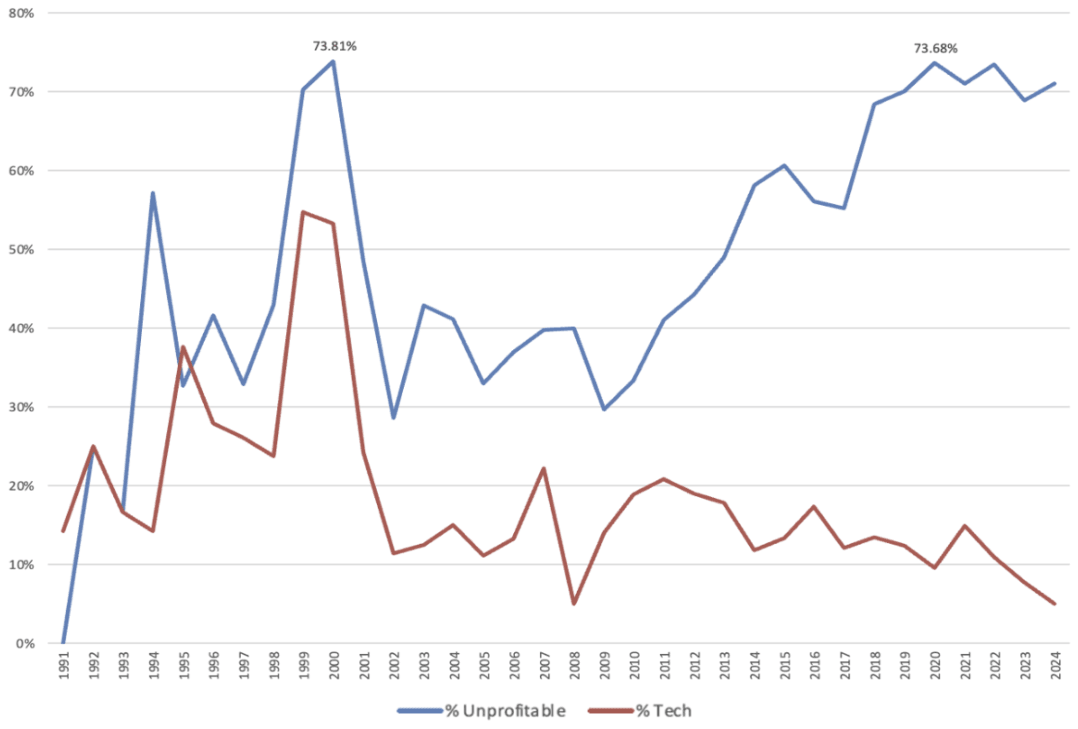
Similar to the dot-com bubble, the AI boom is characterized by rising valuation multiples. The P/E ratio for mega-cap technology companies was higher during the dot-com bubble at 57.1 compared to 34.2 now, but both are significantly above the median of 20.2 between the periods. All companies with high R&D-to-sales consistently have higher valuations, but this premium has increasingly concentrated on technology companies during the AI boom. Non-tech companies with high R&D-to-sales saw their P/E ratios decline from 41.6 during the dot-com bubble to 26.3. In contrast, technology companies with high R&D-to-sales have the highest P/E of 47.9 during the AI boom, compared to 45.8 in the dot-com bubble. Additionally, both periods have the highest proportion of unprofitable IPOs in the sample, consistently remaining above 70%, although in the AI boom there are fewer technology IPOs.
Even with similarly inflated valuations, the technology sector has less volatile gross margins, with standard deviations for Telecommunications, Software, and Semiconductors nearly halving from 2.7%, 2.6%, and 1.5% to 1.4%, 1.2%, and 0.8% respectively. Additionally, both their gross margins and R&D-to-sales are higher. Non-tech companies’ R&D-to-sales ratios have increased from 3.3% to 6.1%, possibly justifying the recent unprofitability of IPOs and reflecting a broader emphasis on long-term growth that supports current high valuations. In conclusion, while the AI boom shares similarities with the dot-com bubble, it is better positioned for sustainable growth, supported by increased R&D and a stable technology value chain, diminishing the likelihood of a similar collapse.
Introduction
The late 1990s dot-com bubble was driven by enthusiasm for the internet and emerging tech startups. Investors poured massive capital into these ventures, leading to extreme overvaluation in the technology sector and numerous unprofitable IPOs. When the bubble burst in 2000, the NASDAQ fell by over 75% and trillions in market value was lost. Today we are witnessing a similar excitement around artificial intelligence. AI’s potential to revolutionize industries has attracted investment much like the internet did, resulting in soaring valuations and a surge of AI startups. Even with recession predictions, the market has continued to rise, highlighting the importance of investigating tail risks in such a bullish environment. This raises the question: to what extent does the current AI boom mirror the conditions of the dot-com bubble, and is it at risk of a similar collapse?
To answer this question, I analyzed various financial metrics to determine whether the higher valuations are justified. Specifically, gross margins to understand product profitability and R&D-to-sales ratios to evaluate their reinvestment in developing products needed to fuel their expected fast-paced growth. Additionally, I reviewed valuation multiples, specifically mega-cap Information Technology companies, to focus on key players during both the dot-com bubble and current AI boom. Furthermore, I explored the IPO environment, including the proportion of unprofitable and technology companies each year, which was a signal of unjustified enthusiasm for high-growth companies during the dot-com bubble. This method was chosen to highlight companies’ potential to deliver the value expected by the market and assess whether the AI boom is sustainable or prone to a collapse comparable to the dot-com bubble.
The analysis revealed similarities and differences between the AI boom and the late 1990s dot-com bubble. Both periods are marked by a substantial proportion of unprofitable IPOs and high valuation multiples, particularly within the Information Technology sector. However, the AI boom features fewer technology IPOs, increased R&D investment across sectors, and a more stable technology value chain. These factors provide a stronger foundation for sustainable growth, reducing the likelihood of a drastic collapse. Unlike the dot-com bubble, which was largely driven by speculation, the AI boom reflects a deeper commitment to innovation and long-term value creation.
Method and Data
Market Analysis
To compare the AI boom to the dot-com bubble I conducted a comprehensive analysis of the US market from 1990 to 2024. The dataset was initially screened using CUSIPs from FactSet, gathering the companies listed on the NYSE and NASDAQ from 1990 to 2024. I then accessed Compustat through WRDS and gathered data over 138 quarters from Q1 1990 to Q2 2024. I extracted the GICS sector and industry group codes and financial variables including market value, closing price, shares outstanding, cash and cash equivalents, debt, TTM EPS, and quarterly EBITDA, EBIT, sales, and R&D expenditure to provide a comprehensive overview. The dataset consisted of 12,610 companies and 653,567 observations, ensuring a complete representation of the US market across different periods.
I began by calculating gross, EBITDA, and EBIT margins. Next, I found enterprise value along with TTM Sales and TTM EBITDA to compute accurate EV/Sales and EV/EBITDA multiples. Additionally, I found P/E through the quarterly closing price and TTM EPS. These multiples were valuable for comparing valuations across the following groups. Companies were split into four periods: before the dot-com bubble (1), dot-com bubble (2), in-between (3), and the AI boom (4). The dot-com bubble is defined as spanning from Q1 1995 to Q2 2000, while the AI boom from Q4 2022 to Q2 2024. Within each period, companies were further categorized into five market-cap groups adjusted for inflation (Table 1). This breakdown allowed for a detailed analysis for market trends and company performance across economic cycles.
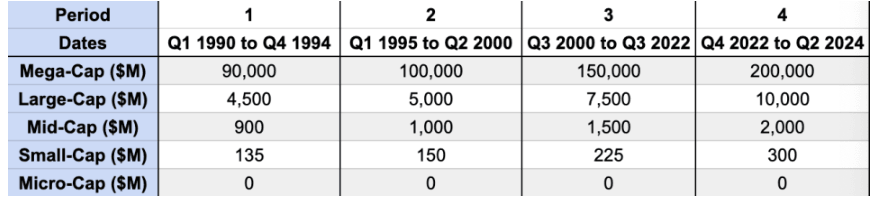
A key metric used to determine reinvestment in innovation was R&D-to-sales. Using this, I established 18.6% R&D-to-Sales (65th percentile) as a threshold and used the GICS sector code for Information Technology to split companies into four groups based on their sector and R&D investment level. These groups allowed for a clear comparison of how technology companies and R&D investment impact valuations.
Due to the limited number of observations in the first period (Q1 1990 to Q4 1994), I excluded it from certain results. Additionally, I removed observations above the 99th percentile and below the 1st percentile for key variables to account for extreme outliers. With these adjustments, descriptive statistics of the dataset used are presented in Table 2 below.

Finally, I grouped unprofitable companies (determined by negative EBIT), non-tech companies, and Q1 2000 and Q2 2024, the peaks of the dot-com bubble and AI boom respectively. I further segmented the market based on the R&D-to-Sales threshold and GICS sectors and industry groups. For each period and quarter, I found the median values of the calculated value for both the overall market and each individual group.
IPO Analysis
To further compare these periods, I analyzed the IPO environment with a focus on technology firms and unprofitable companies. Using CUSIPs from FactSet, I screened IPOs listed on the NYSE and NASDAQ from 1990 to 2024 resulting in 1,459 IPO listings. I then gathered annual financials for each IPO including market value, debt, cash, EBIT, and sales using Compustat through WRDS for a total of 70,936 observations.
Using this dataset, I calculated key valuation metrics, Price-to-Sales and EV/Sales, using sales ratios due to the number of unprofitable companies. Profitability was determined by whether EBIT was negative, and I created a subset of Information Technology IPOs in order to focus on the valuations of specifically technology IPOs. Finally, I found the percentage of unprofitable IPOs and technology IPOs and the median of calculated values for each year.
Results
After analyzing many variables, I determined the most significant factors to compare the conditions of the AI boom with the dot-com bubble were R&D Expenditure, Valuation, and the IPO Environment. These areas were chosen due to their impact on understanding the potential for sustainable growth, market dynamics, and investor behavior. The following sections present the findings and insights from these areas.
R&D Expenditure
To assess the role of R&D investment on company performance during the AI boom compared with the dot-com bubble, I examined the R&D expenditure as a percentage of sales for companies in the Software, Hardware, Semiconductor, and Telecommunication GICS industry groups over four periods alongside the market and non-technology companies.
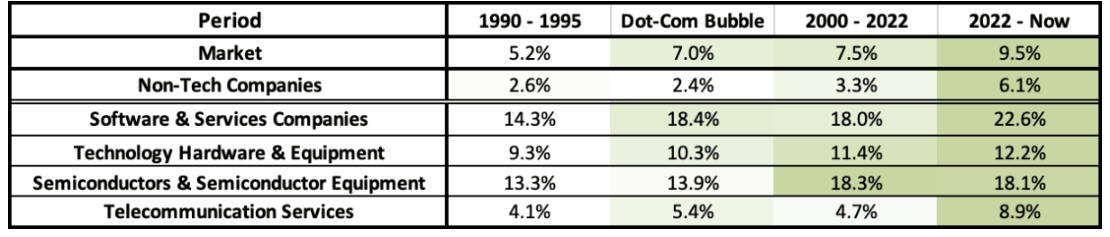
As shown in Table 3, the AI boom exhibits the highest R&D-to-sales with the market median rising to 9.5% from 7% in the dot-com bubble. R&D spending has steadily increased among Hardware companies, while Semiconductor companies saw a slight decrease of 0.2% compared to the previous period, but the most relevant results lie in the Software and Telecommunication industry groups. During the dot-com bubble, Software and Telecommunication had R&D-to-sales ratios of 18.4% and 5.4%, slightly higher than 18% and 4.7% from 2000 to 2022. This increase is a similarity between the two periods, with greater intensity during the AI boom at 22.6% for Software and 12.2% for Telecommunication. However, this isn’t unique to the technology sector as even non-tech companies’ R&D-to-sales have significantly increased from 3.3% to 6.1% in the past two years. While it’s possible that non-tech firms are classifying more expenses as R&D, this trend reflects how recent technological breakthroughs like AI have unlocked vast opportunities across all industries.
To evaluate how increased R&D expenditure impacts product profitability, I examined the gross margins of the same technology industry groups over time, depicted in Figure 1 below.
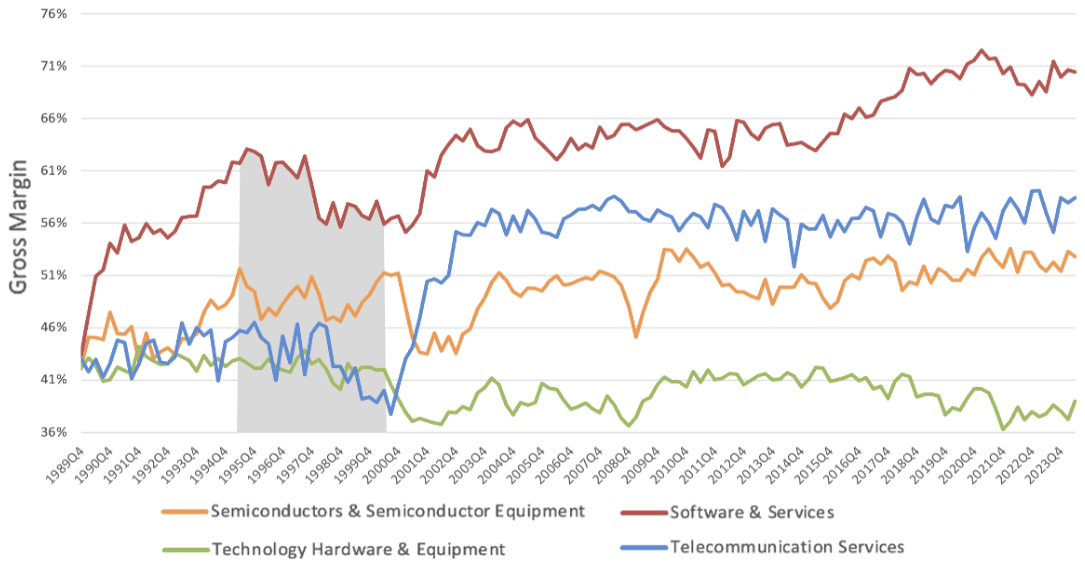
Median gross margins for Software companies peaked early in the dot-com bubble at 63% and rapidly fell to 56% over the next five years, rebounding to 71% since. Similarly, Telecommunication companies’ margins plummeted to 38% during the bubble but stabilized between 56% and 58% by 2003. The standard deviations of gross margins for Software and Telecommunication companies were 2.6% and 2.7%, respectively, during the dot-com bubble, but have declined significantly to 1.2% and 1.4% in the AI boom. Semiconductor companies’ median gross margins were similarly volatile during the dot-com bubble, ranging from 46% to 52% with a standard deviation of 1.5%, but have since stabilized at 52% with a lower standard deviation of 0.8% during the AI boom. Hardware companies have seen minimal changes experiencing a slight downward trend over time, with the standard deviation decreasing slightly from 0.8% during the dot-com bubble to 0.6% in the AI boom.
Since the dot-com bubble’s volatility, Information Technology industry groups have more stable gross margins, suggesting a more sustainable business model across the technology value chain. Additionally, increased R&D investment in Software and Telecommunications has translated into successful product development and stronger margins. Building on these findings, I further examined the effect of R&D expenditure on valuations.
Valuation
To understand the impact of high R&D investment on company valuations across each period I used the median P/E, EV/Sales, and EV/EBITDA multiples across technology and non-tech firms separated by the R&D-to-Sales threshold of 18.6% (65th percentile) shown in Table 4.
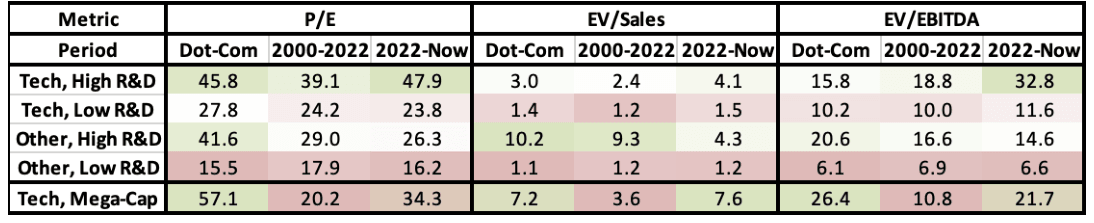
Information Technology companies with high R&D-to-sales during the AI boom have the highest valuations across all periods (except for EV/Sales of other high R&D companies), exceeding levels seen during the dot-com bubble. Most notably, their EV/EBITDA surged to 32.8 from 15.8, however, their P/E is only a bit higher at 47.9 from 45.8 in the dot-com bubble. High R&D investment overall consistently leads to significantly higher valuations, displaying how investors place a premium on innovation and growth potential which has driven the surge in investment in both the dot-com bubble and AI boom. However, in non-technology sectors, companies with high R&D saw a decrease in valuation over time, with the median P/E ratio declining from 41.6 to 26.3 in the AI boom. This suggests the shift in focus on innovation has skewed towards technology companies. Both groups of low R&D companies have relatively stable valuations over time, demonstrating the surge in investment during both the dot-com bubble and AI boom focused on companies with high R&D expenditure.
An important factor driving growth and high investor expectations during the dot-com bubble and current AI boom was the dominance of the largest companies. At the peak of the dot-com bubble (Q1 2000) the largest 10 companies made up 21% of the total market capitalization of the NYSE and NASDAQ, and as of Q2 2024 the largest 10 companies make up 32%. To further examine larger companies I determined the valuation multiples of mega-cap Information Technology companies, shown in Table 4 above.
The valuation of mega-cap Information Technology companies is significantly elevated during both the AI boom and dot-com bubble. Specifically, the P/E ratio was significantly higher during the dot-com bubble at 57.1 compared to 34.3 now, showing how investors had even higher expectations for the growth of large companies during the dot-com bubble. Similarly, the EV/EBITDA was higher, however, the EV/Sales is slightly higher during the AI boom at 7.6 than it was during the dot-com bubble at 7.2. This implies investors are prioritizing revenue growth and have confidence in that growth even with lower earnings.
IPO Environment
Through analyzing the IPO dataset, I found that during the dot-com bubble, both the percentage of unprofitable companies (73.8%) and technology-focused IPOs (54.8%) peaked. Additionally, the Price-to-Sales ratio peaked in 1999, reaching 22.3 for all companies and 35.1 for technology companies, indicating their overvaluation. As shown in Figure 2, unprofitable companies remained just above 70% throughout both periods, while technology IPOs declined significantly from over 50% during the dot-com bubble to only 8% in 2023. This trend is supported by the elevated R&D-to-sales ratios, which have nearly doubled for non-tech companies (Table 3). This justifies the increase in unprofitable IPOs and reflects investors’ prioritization of future growth and innovation, despite current unprofitability.
Conclusion
The AI boom and the dot-com bubble share similarities and differences. Both periods are characterized by elevated valuation multiples and significant investment in pioneering technologies from companies prioritizing R&D. Additionally, the high percentage of unprofitable IPOs across both periods further reflects speculative investment behaviors. However, the AI boom stands out with fewer technology IPOs, likely due to the increased concentration of mega-cap technology companies today. Moreover, the elevated R&D expenditure across non-tech firms suggests that today’s unprofitable IPOs are better positioned than during the dot-com bubble. Higher R&D spending, a more stable technology value chain, and improved gross margins in the Software and Telecommunication industries highlight the effective translation of investments into successful and scalable products. This widespread R&D investment reflects AI’s influence and the drive for innovation across industries. These differences demonstrate that AI has the potential to create the value expected in such a short time frame, in contrast to the dot-com bubble.
Unlike the dot-com bubble, where high valuations often lacked fundamental support, the current AI-driven era shows a larger focus on rapid growth and consistently improving products. This focus on product innovation, along with a more mature and stable technology industry, help offset the risks faced during the dot-com bubble. Overall, while the AI boom shares some traits with the dot-com era, its emphasis on innovation supports a more sustainable growth trajectory.